Climate and Average Weather Year Round in Ubaté ColombiaThe climate in Ubaté is cool and overcast. Over the course of the year, the temperature typically varies from 44°F to 66°F and is rarely below 36°F or above 70°F. Based on the tourism score, the best times of year to visit Ubaté for warm-weather activities are from late May to mid September and from mid December to late February. Average Temperature in UbatéThe temperature in Ubaté varies so little throughout the year that it is not entirely meaningful to discuss hot and cold seasons.
The figure below shows you a compact characterization of the entire year of hourly average temperatures. The horizontal axis is the day of the year, the vertical axis is the hour of the day, and the color is the average temperature for that hour and day. Average Hourly Temperature in Ubaté
frigid
15°F
freezing
32°F
very cold
45°F
cold
55°F
cool
65°F
comfortable
75°F
warm
85°F
hot
95°F
sweltering
The average hourly temperature, color coded into bands. The shaded overlays indicate night and civil twilight.
Ooty, India (10,115 miles away) and Natubleng, Philippines (10,630 miles) are the far-away foreign places with temperatures most similar to Ubaté (view comparison). 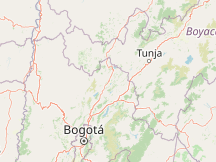

Compare Ubaté to another city:CloudsIn Ubaté, the average percentage of the sky covered by clouds experiences mild seasonal variation over the course of the year. The clearer part of the year in Ubaté begins around June 6 and lasts for 3.5 months, ending around September 21. The clearest month of the year in Ubaté is August, during which on average the sky is clear, mostly clear, or partly cloudy 24% of the time. The cloudier part of the year begins around September 21 and lasts for 8.5 months, ending around June 6. The cloudiest month of the year in Ubaté is April, during which on average the sky is overcast or mostly cloudy 92% of the time.
PrecipitationA wet day is one with at least 0.04 inches of liquid or liquid-equivalent precipitation. The chance of wet days in Ubaté varies very significantly throughout the year. The wetter season lasts 8.7 months, from March 16 to December 6, with a greater than 53% chance of a given day being a wet day. The month with the most wet days in Ubaté is October, with an average of 23.6 days with at least 0.04 inches of precipitation. The drier season lasts 3.3 months, from December 6 to March 16. The month with the fewest wet days in Ubaté is January, with an average of 9.3 days with at least 0.04 inches of precipitation. Among wet days, we distinguish between those that experience rain alone, snow alone, or a mixture of the two. The month with the most days of rain alone in Ubaté is October, with an average of 23.6 days. Based on this categorization, the most common form of precipitation throughout the year is rain alone, with a peak probability of 79% on April 27.
RainfallTo show variation within the months and not just the monthly totals, we show the rainfall accumulated over a sliding 31-day period centered around each day of the year. Ubaté experiences extreme seasonal variation in monthly rainfall. Rain falls throughout the year in Ubaté. The month with the most rain in Ubaté is October, with an average rainfall of 7.8 inches. The month with the least rain in Ubaté is January, with an average rainfall of 1.8 inches. Average Monthly Rainfall in Ubaté
The average rainfall (solid line) accumulated over the course of a sliding 31-day period centered on the day in question, with 25th to 75th and 10th to 90th percentile bands. The thin dotted line is the corresponding average snowfall.
SunThe length of the day in Ubaté does not vary substantially over the course of the year, staying within 25 minutes of 12 hours throughout. In 2024, the shortest day is December 21, with 11 hours, 49 minutes of daylight; the longest day is June 20, with 12 hours, 26 minutes of daylight. Hours of Daylight and Twilight in Ubaté
The number of hours during which the Sun is visible (black line). From bottom (most yellow) to top (most gray), the color bands indicate: full daylight, twilight (civil, nautical, and astronomical), and full night.
The earliest sunrise is at 5:40 AM on May 22, and the latest sunrise is 31 minutes later at 6:11 AM on February 3. The earliest sunset is at 5:36 PM on November 9, and the latest sunset is 37 minutes later at 6:13 PM on July 17. Daylight saving time (DST) is not observed in Ubaté during 2024. Sunrise & Sunset with Twilight in Ubaté
The solar day over the course of the year 2024. From bottom to top, the black lines are the previous solar midnight, sunrise, solar noon, sunset, and the next solar midnight. The day, twilights (civil, nautical, and astronomical), and night are indicated by the color bands from yellow to gray.
The figure below presents a compact representation of the sun's elevation (the angle of the sun above the horizon) and azimuth (its compass bearing) for every hour of every day in the reporting period. The horizontal axis is the day of the year and the vertical axis is the hour of the day. For a given day and hour of that day, the background color indicates the azimuth of the sun at that moment. The black isolines are contours of constant solar elevation. Solar Elevation and Azimuth in Ubaté
northeastsouthwest
Solar elevation and azimuth over the course of the year 2024. The black lines are lines of constant solar elevation (the angle of the sun above the horizon, in degrees). The background color fills indicate the azimuth (the compass bearing) of the sun. The lightly tinted areas at the boundaries of the cardinal compass points indicate the implied intermediate directions (northeast, southeast, southwest, and northwest).
MoonThe figure below presents a compact representation of key lunar data for 2024. The horizontal axis is the day, the vertical axis is the hour of the day, and the colored areas indicate when the moon is above the horizon. The vertical gray bars (new Moons) and blue bars (full Moons) indicate key Moon phases. HumidityWe base the humidity comfort level on the dew point, as it determines whether perspiration will evaporate from the skin, thereby cooling the body. Lower dew points feel drier and higher dew points feel more humid. Unlike temperature, which typically varies significantly between night and day, dew point tends to change more slowly, so while the temperature may drop at night, a muggy day is typically followed by a muggy night. The perceived humidity level in Ubaté, as measured by the percentage of time in which the humidity comfort level is muggy, oppressive, or miserable, does not vary significantly over the course of the year, remaining a virtually constant 0% throughout.
WindThis section discusses the wide-area hourly average wind vector (speed and direction) at 10 meters above the ground. The wind experienced at any given location is highly dependent on local topography and other factors, and instantaneous wind speed and direction vary more widely than hourly averages. The average hourly wind speed in Ubaté experiences mild seasonal variation over the course of the year. The windier part of the year lasts for 3.7 months, from May 30 to September 20, with average wind speeds of more than 3.3 miles per hour. The windiest month of the year in Ubaté is July, with an average hourly wind speed of 4.3 miles per hour. The calmer time of year lasts for 8.3 months, from September 20 to May 30. The calmest month of the year in Ubaté is November, with an average hourly wind speed of 2.3 miles per hour.
The predominant average hourly wind direction in Ubaté is from the east throughout the year. Wind Direction in Ubaté
northeastsouthwest
The percentage of hours in which the mean wind direction is from each of the four cardinal wind directions, excluding hours in which the mean wind speed is less than 1.0 mph. The lightly tinted areas at the boundaries are the percentage of hours spent in the implied intermediate directions (northeast, southeast, southwest, and northwest).
Best Time of Year to VisitTo characterize how pleasant the weather is in Ubaté throughout the year, we compute two travel scores. The tourism score favors clear, rainless days with perceived temperatures between 65°F and 80°F. Based on this score, the best times of year to visit Ubaté for general outdoor tourist activities are from late May to mid September and from mid December to late February, with a peak score in the third week of June. Tourism Score in Ubaté
The tourism score (filled area), and its constituents: the temperature score (red line), the cloud cover score (blue line), and the precipitation score (green line).
The beach/pool score favors clear, rainless days with perceived temperatures between 75°F and 90°F. Based on this score, the best time of year to visit Ubaté for hot-weather activities is from mid January to early March, with a peak score in the second week of February. Beach/Pool Score in Ubaté
The beach/pool score (filled area), and its constituents: the temperature score (red line), the cloud cover score (blue line), and the precipitation score (green line).
MethodologyFor each hour between 8:00 AM and 9:00 PM of each day in the analysis period (1980 to 2016), independent scores are computed for perceived temperature, cloud cover, and total precipitation. Those scores are combined into a single hourly composite score, which is then aggregated into days, averaged over all the years in the analysis period, and smoothed. Our cloud cover score is 10 for fully clear skies, falling linearly to 9 for mostly clear skies, and to 1 for fully overcast skies. Our precipitation score, which is based on the three-hour precipitation centered on the hour in question, is 10 for no precipitation, falling linearly to 9 for trace precipitation, and to 0 for 0.04 inches of precipitation or more. Our tourism temperature score is 0 for perceived temperatures below 50°F, rising linearly to 9 for 65°F, to 10 for 75°F, falling linearly to 9 for 80°F, and to 1 for 90°F or hotter. Our beach/pool temperature score is 0 for perceived temperatures below 65°F, rising linearly to 9 for 75°F, to 10 for 82°F, falling linearly to 9 for 90°F, and to 1 for 100°F or hotter. Growing SeasonDefinitions of the growing season vary throughout the world, but for the purposes of this report, we define it as the longest continuous period of non-freezing temperatures (≥ 32°F) in the year (the calendar year in the Northern Hemisphere, or from July 1 until June 30 in the Southern Hemisphere). While it does not do so every year, freezing temperatures are seen in Ubaté over some winters. The day least likely to be in the growing season is January 16, with a 56% chance. Time Spent in Various Temperature Bands and the Growing Season in Ubaté
frigid
15°F
freezing
32°F
very cold
45°F
cold
55°F
cool
65°F
comfortable
75°F
warm
85°F
hot
95°F
sweltering
The percentage of time spent in various temperature bands. The black line is the percentage chance that a given day is within the growing season.
Growing degree days are a measure of yearly heat accumulation used to predict plant and animal development, and defined as the integral of warmth above a base temperature, discarding any excess above a maximum temperature. In this report, we use a base of 50°F and a cap of 86°F. Based on growing degree days alone, the first spring blooms in Ubaté should appear around January 16, only rarely appearing before January 14 or after January 19. Solar EnergyThis section discusses the total daily incident shortwave solar energy reaching the surface of the ground over a wide area, taking full account of seasonal variations in the length of the day, the elevation of the Sun above the horizon, and absorption by clouds and other atmospheric constituents. Shortwave radiation includes visible light and ultraviolet radiation. The average daily incident shortwave solar energy experiences some seasonal variation over the course of the year. The brighter period of the year lasts for 2.0 months, from July 20 to September 20, with an average daily incident shortwave energy per square meter above 5.7 kWh. The brightest month of the year in Ubaté is August, with an average of 5.9 kWh. The darker period of the year lasts for 1.8 months, from October 18 to December 12, with an average daily incident shortwave energy per square meter below 4.8 kWh. The darkest month of the year in Ubaté is November, with an average of 4.6 kWh.
TopographyFor the purposes of this report, the geographical coordinates of Ubaté are 5.309 deg latitude, -73.816 deg longitude, and 8,402 ft elevation. The topography within 2 miles of Ubaté contains very significant variations in elevation, with a maximum elevation change of 1,401 feet and an average elevation above sea level of 8,579 feet. Within 10 miles contains very significant variations in elevation (3,740 feet). Within 50 miles also contains extreme variations in elevation (11,893 feet). The area within 2 miles of Ubaté is covered by trees (36%), grassland (27%), cropland (26%), and shrubs (10%), within 10 miles by trees (46%) and grassland (30%), and within 50 miles by trees (56%) and grassland (20%). Data SourcesThis report illustrates the typical weather in Ubaté, based on a statistical analysis of historical hourly weather reports and model reconstructions from January 1, 1980 to December 31, 2016. Temperature and Dew PointThere is only a single weather station, El Dorado International Airport, in our network suitable to be used as a proxy for the historical temperature and dew point records of Ubaté. At a distance of 77 kilometers from Ubaté, closer than our threshold of 150 kilometers, this station is deemed sufficiently nearby to be relied upon as our primary source for temperature and dew point records. The station records are corrected for the elevation difference between the station and Ubaté according to the International Standard Atmosphere , and by the relative change present in the MERRA-2 satellite-era reanalysis between the two locations. Please note that the station records themselves may additionally have been back-filled using other nearby stations or the MERRA-2 reanalysis. Other DataAll data relating to the Sun's position (e.g., sunrise and sunset) are computed using astronomical formulas from the book, Astronomical Algorithms 2nd Edition , by Jean Meeus. All other weather data, including cloud cover, precipitation, wind speed and direction, and solar flux, come from NASA's MERRA-2 Modern-Era Retrospective Analysis . This reanalysis combines a variety of wide-area measurements in a state-of-the-art global meteorological model to reconstruct the hourly history of weather throughout the world on a 50-kilometer grid. Land Use data comes from the Global Land Cover SHARE database , published by the Food and Agriculture Organization of the United Nations. Elevation data comes from the Shuttle Radar Topography Mission (SRTM) , published by NASA's Jet Propulsion Laboratory. Names, locations, and time zones of places and some airports come from the GeoNames Geographical Database . Time zones for airports and weather stations are provided by AskGeo.com . Maps are © OpenStreetMap contributors. DisclaimerThe information on this site is provided as is, without any assurances as to its accuracy or suitability for any purpose. Weather data is prone to errors, outages, and other defects. We assume no responsibility for any decisions made on the basis of the content presented on this site. We draw particular cautious attention to our reliance on the MERRA-2 model-based reconstructions for a number of important data series. While having the tremendous advantages of temporal and spatial completeness, these reconstructions: (1) are based on computer models that may have model-based errors, (2) are coarsely sampled on a 50 km grid and are therefore unable to reconstruct the local variations of many microclimates, and (3) have particular difficulty with the weather in some coastal areas, especially small islands. We further caution that our travel scores are only as good as the data that underpin them, that weather conditions at any given location and time are unpredictable and variable, and that the definition of the scores reflects a particular set of preferences that may not agree with those of any particular reader. Please review our full terms contained on our Terms of Service page. |
