Loading…

  1. WeatherSpark.com
  2. Albania
  3. Kukës
  4. Gjinaj

Summer Weather in Gjinaj Albania

01 · Temperature

Daily high temperatures increase by 7°F, from 73°F to 79°F, rarely falling below 63°F or exceeding 92°F. The highest daily average high temperature is 84°F on August 5.

Daily low temperatures are around 56°F, rarely falling below 47°F or exceeding 64°F. The highest daily average low temperature is 60°F on July 31.

For reference, on August 5, the hottest day of the year, temperatures in Gjinaj typically range from 59°F to 84°F, while on January 19, the coldest day of the year, they range from 26°F to 40°F.

Average High and Low Temperature in the Summer in Gjinaj

Average High and Low Temperature in the Summer in GjinajSpringFallJunJulAug35°F45°F55°F65°F75°F85°F95°F35°F45°F55°F65°F75°F85°F95°FAug 584°FAug 584°F59°F59°FJun 173°FJun 173°F52°F52°FJul 180°FJul 180°F57°F57°FSpringFallJunJulAug35°F45°F55°F65°F75°F85°F95°F35°F45°F55°F65°F75°F85°F95°FAug 584°FAug 584°F59°F59°FJun 173°FJun 173°F52°F52°FAug 3179°FAug 3179°F55°F55°FJul 180°FJul 180°F57°F57°FSpringFallJunJulAug35°F40°F45°F50°F55°F60°F65°F70°F75°F80°F85°F90°F95°F35°F40°F45°F50°F55°F60°F65°F70°F75°F80°F85°F90°F95°FAug 584°FAug 584°F59°F59°FJun 173°FJun 173°F52°F52°FAug 3179°FAug 3179°F55°F55°FJul 180°FJul 180°F57°F57°FSpringFallJunJulAug35°F40°F45°F50°F55°F60°F65°F70°F75°F80°F85°F90°F95°F35°F40°F45°F50°F55°F60°F65°F70°F75°F80°F85°F90°F95°FAug 584°FAug 584°F59°F59°FJun 173°FJun 173°F52°F52°FAug 3179°FAug 3179°F55°F55°FJul 180°FJul 180°F57°F57°F
High Low Perceived high Perceived low 25th to 75th percentile 10th to 90th percentile
The daily average high (red line) and low (blue line) temperature, with 25th to 75th and 10th to 90th percentile bands. The thin dotted lines are the corresponding average perceived temperatures.

The figure below shows you a compact characterization of the hourly average summer temperatures. The horizontal axis is the day, the vertical axis is the hour of the day, and the color is the average temperature for that hour and day.

Average Hourly Temperature in the Summer in Gjinaj

Average Hourly Temperature in the Summer in GjinajSpringFallJunJulAug12 AM4 AM8 AM12 PM4 PM8 PM12 AM12 AM4 AM8 AM12 PM4 PM8 PM12 AMcoldcoldcoolcoolcomfortablewarmcoldcomfortableSpringFallJunJulAug12 AM4 AM8 AM12 PM4 PM8 PM12 AM12 AM4 AM8 AM12 PM4 PM8 PM12 AMcoldcoldcoolcoolcomfortablewarmcoldcomfortableSpringFallJunJulAug12 AM2 AM4 AM6 AM8 AM10 AM12 PM2 PM4 PM6 PM8 PM10 PM12 AM12 AM2 AM4 AM6 AM8 AM10 AM12 PM2 PM4 PM6 PM8 PM10 PM12 AMcoldcoldcoolcoolcomfortablewarmcomfortablecoldSpringFallJunJulAug12 AM2 AM4 AM6 AM8 AM10 AM12 PM2 PM4 PM6 PM8 PM10 PM12 AM12 AM2 AM4 AM6 AM8 AM10 AM12 PM2 PM4 PM6 PM8 PM10 PM12 AMcoldcoldcoolcoolcomfortablecomfortablewarmcold
frigid 15°F freezing 32°F very cold 45°F cold 55°F cool 65°F comfortable 75°F warm 85°F hot 95°F sweltering
The average hourly temperature, color coded into bands. The shaded overlays indicate night and civil twilight.

Odell, Oregon, United States (5,945 miles away) and Ronceverte, West Virginia, United States (5,019 miles) are the far-away foreign places with temperatures most similar to Gjinaj (view comparison).
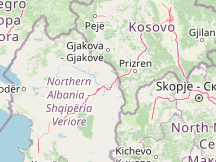
Map
Marker
© OpenStreetMap contributors

Compare Gjinaj to:

Map
02 · Clouds

The summer in Gjinaj experiences rapidly decreasing cloud cover, with the percentage of time that the sky is overcast or mostly cloudy decreasing from 39% to 24%. The lowest chance of overcast or mostly cloudy conditions is 12% on July 21.

The clearest day of the summer is July 21, with clear, mostly clear, or partly cloudy conditions 88% of the time.

For reference, on December 7, the cloudiest day of the year, the chance of overcast or mostly cloudy conditions is 58%, while on July 21, the clearest day of the year, the chance of clear, mostly clear, or partly cloudy skies is 88%.

Cloud Cover Categories in the Summer in Gjinaj

Cloud Cover Categories in the Summer in GjinajSpringFallJunJulAug0%20%40%60%80%100%100%80%60%40%20%0%Dec 742%Dec 742%Jun 161%Jun 161%Jul 182%Jul 182%Aug 187%Aug 187%clearovercastmostly clearpartly cloudySpringFallJunJulAug0%20%40%60%80%100%100%80%60%40%20%0%Dec 742%Dec 742%Jun 161%Jun 161%Aug 3176%Aug 3176%Jul 182%Jul 182%Aug 187%Aug 187%clearovercastmostly clearpartly cloudySpringFallJunJulAug0%10%20%30%40%50%60%70%80%90%100%100%90%80%70%60%50%40%30%20%10%0%Dec 742%Dec 742%Jun 161%Jun 161%Aug 3176%Aug 3176%Jul 182%Jul 182%Aug 187%Aug 187%clearmostly clearovercastpartly cloudymostly cloudySpringFallJunJulAug0%10%20%30%40%50%60%70%80%90%100%100%90%80%70%60%50%40%30%20%10%0%Dec 742%Dec 742%Jun 161%Jun 161%Aug 3176%Aug 3176%Jul 182%Jul 182%Aug 187%Aug 187%clearmostly clearpartly cloudymostly cloudyovercast
0% clear 20% mostly clear 40% partly cloudy 60% mostly cloudy 80% overcast 100%
The percentage of time spent in each cloud cover band, categorized by the percentage of the sky covered by clouds.
03 · Precipitation

A wet day is one with at least 0.04 inches of liquid or liquid-equivalent precipitation. In Gjinaj, the chance of a wet day over the course of the summer is rapidly decreasing, starting the season at 26% and ending it at 19%.

For reference, the year's highest daily chance of a wet day is 33% on November 20, and its lowest chance is 16% on August 17.

Probability of Precipitation in the Summer in Gjinaj

rain mixed snow
The percentage of days in which various types of precipitation are observed, excluding trace quantities: rain alone, snow alone, and mixed (both rain and snow fell in the same day).

Rainfall

To show variation within the season and not just the monthly totals, we show the rainfall accumulated over a sliding 31-day period centered around each day.

The average sliding 31-day rainfall during the summer in Gjinaj is essentially constant, remaining about 1.4 inches throughout, and rarely exceeding 3.6 inches or falling below 0.2 inches.

The lowest average 31-day accumulation is 1.1 inches on July 22.

Average Monthly Rainfall in the Summer in Gjinaj

Rainfall Snowfall 25th to 75th percentile 10th to 90th percentile
The average rainfall (solid line) accumulated over the course of a sliding 31-day period centered on the day in question, with 25th to 75th and 10th to 90th percentile bands. The thin dotted line is the corresponding average snowfall.
04 · Sun

Over the course of the summer in Gjinaj, the length of the day is rapidly decreasing. From the start to the end of the season, the length of the day decreases by 1 hour, 51 minutes, implying an average daily decrease of 1 minute, 13 seconds, and weekly decrease of 8 minutes, 33 seconds.

The shortest day of the summer is August 31, with 13 hours, 12 minutes of daylight and the longest day is June 21, with 15 hours, 15 minutes of daylight.

Hours of Daylight and Twilight in the Summer in Gjinaj

Hours of Daylight and Twilight in the Summer in GjinajSpringFallJunJulAug0 hr8 hr16 hr24 hr24 hr16 hr8 hr0 hrJun 2115 hr, 15 minJun 2115 hr, 15 minnightnightdaydaySpringFallJunJulAug0 hr4 hr8 hr12 hr16 hr20 hr24 hr24 hr20 hr16 hr12 hr8 hr4 hr0 hrJun 2115 hr, 15 minJun 2115 hr, 15 minnightdaydaySpringFallJunJulAug0 hr4 hr8 hr12 hr16 hr20 hr24 hr24 hr20 hr16 hr12 hr8 hr4 hr0 hrJun 2115 hr, 15 minJun 2115 hr, 15 minnightnightdaydayAug 3113 hr, 12 minAug 3113 hr, 12 minAug 114 hr, 26 minAug 114 hr, 26 minSpringFallJunJulAug0 hr4 hr8 hr12 hr16 hr20 hr24 hr24 hr20 hr16 hr12 hr8 hr4 hr0 hrJun 2115 hr, 15 minJun 2115 hr, 15 minnightnightdaydayAug 3113 hr, 12 minAug 3113 hr, 12 minAug 114 hr, 26 minAug 114 hr, 26 min
Hours of daylight Daylight Civil twilight Nautical twilight Astronomical twilight Night
The number of hours during which the Sun is visible (black line). From bottom (most yellow) to top (most gray), the color bands indicate: full daylight, twilight (civil, nautical, and astronomical), and full night.

The earliest sunrise of the summer in Gjinaj is 5:01 AM on June 15 and the latest sunrise is 1 hour, 1 minute later at 6:02 AM on August 31.

The latest sunset is 8:18 PM on June 27 and the earliest sunset is 1 hour, 4 minutes earlier at 7:14 PM on August 31.

Daylight saving time is observed in Gjinaj during 2026, but it neither starts nor ends during the summer, so the entire season is in daylight saving time.

For reference, on June 21, the longest day of the year, the Sun rises at 5:02 AM and sets 15 hours, 15 minutes later, at 8:17 PM, while on December 21, the shortest day of the year, it rises at 7:03 AM and sets 9 hours, 6 minutes later, at 4:09 PM.

Sunrise & Sunset with Twilight in the Summer in Gjinaj

Sunrise & Sunset with Twilight in the Summer in GjinajSpringFallJunJulAug2 AM6 AM10 AM2 PM6 PM10 PM5:01 AM5:01 AMJun 158:16 PMJun 158:16 PM6:02 AM6:02 AMAug 317:14 PMAug 317:14 PMSolarMidnightSolarMidnightSolarNoonSunriseSunsetSpringFallJunJulAug2 AM6 AM10 AM2 PM6 PM10 PM5:01 AM5:01 AMJun 158:16 PMJun 158:16 PM6:02 AM6:02 AMAug 317:14 PMAug 317:14 PM5:31 AM5:31 AMAug 17:57 PMAug 17:57 PMSolarMidnightSolarMidnightSolarNoonSunriseSunsetSpringFallJunJulAug2 AM4 AM6 AM8 AM10 AM12 PM2 PM4 PM6 PM8 PM10 PM12 AM5:01 AM5:01 AMJun 158:16 PMJun 158:16 PM6:02 AM6:02 AMAug 317:14 PMAug 317:14 PM5:31 AM5:31 AMAug 17:57 PMAug 17:57 PMSolarMidnightSolarMidnightSolarNoonSunriseSunsetSpringFallJunJulAug2 AM4 AM6 AM8 AM10 AM12 PM2 PM4 PM6 PM8 PM10 PM12 AM5:01 AM5:01 AMJun 158:16 PMJun 158:16 PM6:02 AM6:02 AMAug 317:14 PMAug 317:14 PM5:04 AM5:04 AMJun 18:07 PMJun 18:07 PM5:06 AM5:06 AMJul 18:18 PMJul 18:18 PM5:31 AM5:31 AMAug 17:57 PMAug 17:57 PMSolarMidnightSolarMidnightSolarNoonSunriseSunset
Daylight Civil twilight Nautical twilight Astronomical twilight Night
The solar day in the summer. From bottom to top, the black lines are the previous solar midnight, sunrise, solar noon, sunset, and the next solar midnight. The day, twilights (civil, nautical, and astronomical), and night are indicated by the color bands from yellow to gray.

The figure below presents a compact representation of the sun's elevation (the angle of the sun above the horizon) and azimuth (its compass bearing) for every hour of every day in the reporting period. The horizontal axis is the day of the year and the vertical axis is the hour of the day. For a given day and hour of that day, the background color indicates the azimuth of the sun at that moment. The black isolines are contours of constant solar elevation.

Solar Elevation and Azimuth in the Summer in Gjinaj

Solar Elevation and Azimuth in the Summer in GjinajSpringFallJunJulAug12 AM4 AM8 AM12 PM4 PM8 PM12 AM12 AM4 AM8 AM12 PM4 PM8 PM12 AM001010101020202020303040404040505050506060707000001010202020203030303040405050505060606060SpringFallJunJulAug12 AM4 AM8 AM12 PM4 PM8 PM12 AM12 AM4 AM8 AM12 PM4 PM8 PM12 AM001010101020202020303040404040505050506060707000001010202020203030303040405050505060606060SpringFallJunJulAug12 AM2 AM4 AM6 AM8 AM10 AM12 PM2 PM4 PM6 PM8 PM10 PM12 AM12 AM2 AM4 AM6 AM8 AM10 AM12 PM2 PM4 PM6 PM8 PM10 PM12 AM001010101020202020303040404040505050506060707000001010202020203030303040405050505060606060SpringFallJunJulAug12 AM2 AM4 AM6 AM8 AM10 AM12 PM2 PM4 PM6 PM8 PM10 PM12 AM12 AM2 AM4 AM6 AM8 AM10 AM12 PM2 PM4 PM6 PM8 PM10 PM12 AM001010101020202020303040404040505050506060707000001010202020203030303040405050505060606060
Sunrise and sunset Solar elevation Night and civil twilight
northeastsouthwest
Solar elevation and azimuth in the the summer of 2026. The black lines are lines of constant solar elevation (the angle of the sun above the horizon, in degrees). The background color fills indicate the azimuth (the compass bearing) of the sun. The lightly tinted areas at the boundaries of the cardinal compass points indicate the implied intermediate directions (northeast, southeast, southwest, and northwest).
05 · Moon

The figure below presents a compact representation of key lunar data for the summer of 2026. The horizontal axis is the day, the vertical axis is the hour of the day, and the colored areas indicate when the moon is above the horizon. The vertical gray bars (new Moons) and blue bars (full Moons) indicate key Moon phases. The label associated with each bar indicates the date and time that the phase is obtained, and the companion time labels indicate the rise and set times of the Moon for the nearest time interval in which the moon is above the horizon.

Moon Rise, Set & Phases in the Summer in Gjinaj

Moon Rise, Set & Phases in the Summer in GjinajSpringFallJunJulAug12 AM8 AM4 PM12 AM12 AM8 AM4 PM12 AMMay 17:24 PMMay 17:24 PMJun 154:55 AMJun 154:55 AMJun 301:57 AMJun 301:57 AMAug 127:37 PMAug 127:37 PM9:14 PM9:14 PM4:59 AM4:59 AM6:55 PM6:55 PMSpringFallJunJulAug12 AM4 AM8 AM12 PM4 PM8 PM12 AM12 AM4 AM8 AM12 PM4 PM8 PM12 AMMay 17:24 PMMay 17:24 PMMay 1610:02 PMMay 1610:02 PMJun 154:55 AMJun 154:55 AMJun 301:57 AMJun 301:57 AMJul 1411:44 AMJul 1411:44 AMJul 294:36 PMJul 294:36 PMAug 127:37 PMAug 127:37 PMAug 286:19 AMAug 286:19 AMSep 115:28 AMSep 115:28 AM7:45 PM7:45 PM5:25 AM5:25 AM9:14 PM9:14 PM8:23 PM8:23 PM4:59 AM4:59 AM8:10 PM8:10 PM7:02 PM7:02 PMSpringFallJunJulAug12 AM4 AM8 AM12 PM4 PM8 PM12 AM12 AM4 AM8 AM12 PM4 PM8 PM12 AMMay 17:24 PMMay 17:24 PMMay 1610:02 PMMay 1610:02 PMMay 3110:46 AMMay 3110:46 AMJun 154:55 AMJun 154:55 AMJun 301:57 AMJun 301:57 AMJul 1411:44 AMJul 1411:44 AMJul 294:36 PMJul 294:36 PMAug 127:37 PMAug 127:37 PMAug 286:19 AMAug 286:19 AMSep 115:28 AMSep 115:28 AMSep 266:50 PMSep 266:50 PM7:45 PM7:45 PM7:57 PM7:57 PM7:44 PM7:44 PM8:23 PM8:23 PM8:40 PM8:40 PM8:10 PM8:10 PM6:02 AM6:02 AM7:43 PM7:43 PM7:02 PM7:02 PM6:04 AM6:04 AM6:55 PM6:55 PM7:14 AM7:14 AMSpringFallJunJulAug12 AM4 AM8 AM12 PM4 PM8 PM12 AM12 AM4 AM8 AM12 PM4 PM8 PM12 AMMay 17:24 PMMay 17:24 PMMay 1610:02 PMMay 1610:02 PMMay 3110:46 AMMay 3110:46 AMJun 154:55 AMJun 154:55 AMJun 301:57 AMJun 301:57 AMJul 1411:44 AMJul 1411:44 AMJul 294:36 PMJul 294:36 PMAug 127:37 PMAug 127:37 PMAug 286:19 AMAug 286:19 AMSep 115:28 AMSep 115:28 AMSep 266:50 PMSep 266:50 PM7:45 PM7:45 PM5:25 AM5:25 AM7:57 PM7:57 PM7:44 PM7:44 PM4:42 AM4:42 AM9:14 PM9:14 PM8:23 PM8:23 PM4:59 AM4:59 AM4:45 AM4:45 AM8:40 PM8:40 PM8:10 PM8:10 PM6:02 AM6:02 AM7:43 PM7:43 PM7:02 PM7:02 PM6:04 AM6:04 AM6:55 PM6:55 PM6:09 PM6:09 PM7:14 AM7:14 AM
Moon above the horizon Full moon New moon Night and civil twilight
The time in which the moon is above the horizon (light blue area), with new moons (dark gray lines) and full moons (blue lines) indicated. The shaded overlays indicate night and civil twilight.
06 · Humidity

We base the humidity comfort level on the dew point, as it determines whether perspiration will evaporate from the skin, thereby cooling the body. Lower dew points feel drier and higher dew points feel more humid. Unlike temperature, which typically varies significantly between night and day, dew point tends to change more slowly, so while the temperature may drop at night, a muggy day is typically followed by a muggy night.

The chance that a given day will be muggy in Gjinaj is essentially constant during the summer, remaining around 1% throughout.

The highest chance of a muggy day during the summer is 1% on June 27.

For reference, on June 27, the muggiest day of the year, there are muggy conditions 1% of the time, while on October 5, the least muggy day of the year, there are muggy conditions 0% of the time.

Humidity Comfort Levels in the Summer in Gjinaj

Humidity Comfort Levels in the Summer in GjinajSpringFallJunJulAug0%20%40%60%80%100%0%20%40%60%80%100%Jun 271%Jun 271%Aug 310%Aug 310%humidhumidcomfortablecomfortabledrydrySpringFallJunJulAug0%20%40%60%80%100%0%20%40%60%80%100%Jun 271%Jun 271%Jun 10%Jun 10%Aug 310%Aug 310%Aug 11%Aug 11%comfortablecomfortabledrydrySpringFallJunJulAug0%10%20%30%40%50%60%70%80%90%100%0%10%20%30%40%50%60%70%80%90%100%Jun 271%Jun 271%Jun 10%Jun 10%Aug 310%Aug 310%Aug 11%Aug 11%humidhumidcomfortablecomfortabledrydrySpringFallJunJulAug0%10%20%30%40%50%60%70%80%90%100%0%10%20%30%40%50%60%70%80%90%100%Jun 271%Jun 271%Jun 10%Jun 10%Aug 310%Aug 310%Aug 11%Aug 11%humidhumidcomfortablecomfortabledrydry
dry 55°F comfortable 60°F humid 65°F muggy 70°F oppressive 75°F miserable
The percentage of time spent at various humidity comfort levels, categorized by dew point.
07 · Wind

This section discusses the wide-area hourly average wind vector (speed and direction) at 10 meters above the ground. The wind experienced at any given location is highly dependent on local topography and other factors, and instantaneous wind speed and direction vary more widely than hourly averages.

The average hourly wind speed in Gjinaj is essentially constant during the summer, remaining within 0.2 miles per hour of 4.9 miles per hour throughout.

For reference, on February 24, the windiest day of the year, the daily average wind speed is 6.8 miles per hour, while on August 12, the calmest day of the year, the daily average wind speed is 4.8 miles per hour.

The lowest daily average wind speed during the summer is 4.8 miles per hour on August 12.

Average Wind Speed in the Summer in Gjinaj

Wind Speed 25th to 75th percentile 10th to 90th percentile
The average of mean hourly wind speeds (dark gray line), with 25th to 75th and 10th to 90th percentile bands.

The wind direction in Gjinaj during the summer is predominantly out of the west from June 1 to July 2, the north from July 2 to August 1, and the east from August 1 to August 31.

Wind Direction in the Summer in Gjinaj

Wind Direction in the Summer in GjinajWNESpringFallJunJulAug0%30%60%90%100%70%40%10%westwesteasteastnorthnorthsouthsouthWNESpringFallJunJulAug0%20%40%60%80%100%100%80%60%40%20%0%westwestnorthnortheasteastsouthsouthWNESpringFallJunJulAug0%20%40%60%80%100%100%80%60%40%20%0%westwestnorthnortheasteastsouthsouthWNESpringFallJunJulAug0%10%20%30%40%50%60%70%80%90%100%100%90%80%70%60%50%40%30%20%10%0%westwesteasteastnorthnorthsouthsouth
northeastsouthwest
The percentage of hours in which the mean wind direction is from each of the four cardinal wind directions, excluding hours in which the mean wind speed is less than 1.0 mph. The lightly tinted areas at the boundaries are the percentage of hours spent in the implied intermediate directions (northeast, southeast, southwest, and northwest).
08 · Growing Season

Definitions of the growing season vary throughout the world, but for the purposes of this report, we define it as the longest continuous period of non-freezing temperatures (≥ 32°F) in the year (the calendar year in the Northern Hemisphere, or from July 1 until June 30 in the Southern Hemisphere).

The growing season in Gjinaj typically lasts for 6.8 months (210 days), from around April 2 to around October 29, rarely starting before March 10 or after April 26, and rarely ending before October 10 or after November 18.

The summer in Gjinaj is reliably fully within the growing season.

Time Spent in Various Temperature Bands and the Growing Season in the Summer in Gjinaj

Time Spent in Various Temperature Bands and the Growing Season in the Summer in Gjinajgrowing seasongrowing seasongrowing seasonSpringFallJunJulAug0%30%60%90%100%70%40%10%100%Jul 17100%Jul 17coldcoolcomfortablewarmgrowing seasongrowing seasongrowing seasonSpringFallJunJulAug0%20%40%60%80%100%100%80%60%40%20%0%100%Jul 17100%Jul 17coldcoolcomfortablewarmhotvery coldgrowing seasongrowing seasongrowing seasonSpringFallJunJulAug0%20%40%60%80%100%100%80%60%40%20%0%100%Jul 17100%Jul 17coldcoolcomfortablewarmhotvery coldgrowing seasongrowing seasongrowing seasonSpringFallJunJulAug0%10%20%30%40%50%60%70%80%90%100%100%90%80%70%60%50%40%30%20%10%0%100%Jul 17100%Jul 17coldcoolcomfortablewarmhotvery cold
frigid 15°F freezing 32°F very cold 45°F cold 55°F cool 65°F comfortable 75°F warm 85°F hot 95°F sweltering
The percentage of time spent in various temperature bands. The black line is the percentage chance that a given day is within the growing season.

Growing degree days are a measure of yearly heat accumulation used to predict plant and animal development, and defined as the integral of warmth above a base temperature, discarding any excess above a maximum temperature. In this report, we use a base of 50°F and a cap of 86°F.

The average accumulated growing degree days in Gjinaj are very rapidly increasing during the summer, increasing by 1,727°F, from 486°F to 2,212°F, over the course of the season.

Growing Degree Days in the Summer in Gjinaj

Growing Degree Days in the Summer in GjinajSpringFallJunJulAug400°F1,000°F1,600°F2,200°F400°F1,000°F1,600°F2,200°FJun 1486°FJun 1486°FAug 312,212°FAug 312,212°FJul 1975°FJul 1975°FSpringFallJunJulAug400°F800°F1,200°F1,600°F2,000°F2,400°F400°F800°F1,200°F1,600°F2,000°F2,400°FJun 1486°FJun 1486°FAug 312,212°FAug 312,212°FJul 1975°FJul 1975°FAug 11,613°FAug 11,613°FSpringFallJunJulAug400°F800°F1,200°F1,600°F2,000°F2,400°F400°F800°F1,200°F1,600°F2,000°F2,400°FJun 1486°FJun 1486°FAug 312,212°FAug 312,212°FJul 1975°FJul 1975°FAug 11,613°FAug 11,613°FSpringFallJunJulAug400°F600°F800°F1,000°F1,200°F1,400°F1,600°F1,800°F2,000°F2,200°F2,400°F400°F600°F800°F1,000°F1,200°F1,400°F1,600°F1,800°F2,000°F2,200°F2,400°FJun 1486°FJun 1486°FAug 312,212°FAug 312,212°FJul 1975°FJul 1975°FAug 11,613°FAug 11,613°F
Growing degree days 25th to 75th percentile 10th to 90th percentile
The average growing degree days accumulated over the course of the summer, with 25th to 75th and 10th to 90th percentile bands.
09 · Solar Energy

This section discusses the total daily incident shortwave solar energy reaching the surface of the ground over a wide area, taking full account of seasonal variations in the length of the day, the elevation of the Sun above the horizon, and absorption by clouds and other atmospheric constituents. Shortwave radiation includes visible light and ultraviolet radiation.

The average daily incident shortwave solar energy in Gjinaj is gradually decreasing during the summer, falling by 0.9 kWh, from 6.8 kWh to 5.9 kWh, over the course of the season.

The highest average daily incident shortwave solar energy during the summer is 7.6 kWh on July 7.

Average Daily Incident Shortwave Solar Energy in the Summer in Gjinaj

Average Daily Incident Shortwave Solar Energy in the Summer in GjinajSpringFallJunJulAug0 kWh2 kWh4 kWh6 kWh8 kWh0 kWh2 kWh4 kWh6 kWh8 kWhJul 77.6 kWhJul 77.6 kWhAug 315.9 kWhAug 315.9 kWhSpringFallJunJulAug0 kWh2 kWh4 kWh6 kWh8 kWh0 kWh2 kWh4 kWh6 kWh8 kWhJul 77.6 kWhJul 77.6 kWhJun 16.8 kWhJun 16.8 kWhAug 315.9 kWhAug 315.9 kWhSpringFallJunJulAug0 kWh1 kWh2 kWh3 kWh4 kWh5 kWh6 kWh7 kWh8 kWh9 kWh0 kWh1 kWh2 kWh3 kWh4 kWh5 kWh6 kWh7 kWh8 kWh9 kWhJul 77.6 kWhJul 77.6 kWhJun 16.8 kWhJun 16.8 kWhAug 315.9 kWhAug 315.9 kWhAug 17.2 kWhAug 17.2 kWhSpringFallJunJulAug0 kWh1 kWh2 kWh3 kWh4 kWh5 kWh6 kWh7 kWh8 kWh9 kWh0 kWh1 kWh2 kWh3 kWh4 kWh5 kWh6 kWh7 kWh8 kWh9 kWhJul 77.6 kWhJul 77.6 kWhJun 16.8 kWhJun 16.8 kWhAug 315.9 kWhAug 315.9 kWhAug 17.2 kWhAug 17.2 kWh
Shortwave solar energy 25th to 75th percentile 10th to 90th percentile
The average daily shortwave solar energy reaching the ground per square meter (orange line), with 25th to 75th and 10th to 90th percentile bands.
10 · Topography

For the purposes of this report, the geographical coordinates of Gjinaj are 42.118 deg latitude, 20.436 deg longitude, and 2,313 ft elevation.

The topography within 2 miles of Gjinaj contains extreme variations in elevation, with a maximum elevation change of 3,346 feet and an average elevation above sea level of 2,199 feet. Within 10 miles also contains extreme variations in elevation (7,165 feet). Within 50 miles also contains extreme variations in elevation (8,967 feet).

The area within 2 miles of Gjinaj is covered by trees (54%), shrubs (18%), and sparse vegetation (11%), within 10 miles by trees (55%) and cropland (16%), and within 50 miles by trees (53%) and cropland (22%).

11 · Data Sources

This report illustrates the typical weather in Gjinaj, based on a statistical analysis of historical hourly weather reports and model reconstructions from January 1, 1980 to December 31, 2016.

Temperature and Dew Point

There are 5 weather stations near enough to contribute to our estimation of the temperature and dew point in Gjinaj.

For each station, the records are corrected for the elevation difference between that station and Gjinaj according to the International Standard Atmosphere , and by the relative change present in the MERRA-2 satellite-era reanalysis between the two locations.

The estimated value at Gjinaj is computed as the weighted average of the individual contributions from each station, with weights proportional to the inverse of the distance between Gjinaj and a given station.

The stations contributing to this reconstruction are:

To get a sense of how much these sources agree with each other, you can view a comparison of Gjinaj and the stations that contribute to our estimates of its temperature history and climate. Please note that each source's contribution is adjusted for elevation and the relative change present in the MERRA-2 data.

Other Data

All data relating to the Sun's position (e.g., sunrise and sunset) are computed using astronomical formulas from the book, Astronomical Algorithms 2nd Edition , by Jean Meeus.

All other weather data, including cloud cover, precipitation, wind speed and direction, and solar flux, come from NASA's MERRA-2 Modern-Era Retrospective Analysis . This reanalysis combines a variety of wide-area measurements in a state-of-the-art global meteorological model to reconstruct the hourly history of weather throughout the world on a 50-kilometer grid.

Land Use data comes from the Global Land Cover SHARE database , published by the Food and Agriculture Organization of the United Nations.

Elevation data comes from the Shuttle Radar Topography Mission (SRTM) , published by NASA's Jet Propulsion Laboratory.

Names, locations, and time zones of places and some airports come from the GeoNames Geographical Database .

Time zones for airports and weather stations are provided by AskGeo.com .

Maps are © OpenStreetMap contributors.

Disclaimer

The information on this site is provided as is, without any assurances as to its accuracy or suitability for any purpose. Weather data is prone to errors, outages, and other defects. We assume no responsibility for any decisions made on the basis of the content presented on this site.

We draw particular cautious attention to our reliance on the MERRA-2 model-based reconstructions for a number of important data series. While having the tremendous advantages of temporal and spatial completeness, these reconstructions: (1) are based on computer models that may have model-based errors, (2) are coarsely sampled on a 50 km grid and are therefore unable to reconstruct the local variations of many microclimates, and (3) have particular difficulty with the weather in some coastal areas, especially small islands.

We further caution that our travel scores are only as good as the data that underpin them, that weather conditions at any given location and time are unpredictable and variable, and that the definition of the scores reflects a particular set of preferences that may not agree with those of any particular reader.

Please review our full terms contained on our Terms of Service page.