Loading…

March 2025 Weather History at Columbus Airport

This report shows the past weather for Columbus Airport, providing a weather history for March 2025. It features all historical weather data series we have available, including the Columbus Airport temperature history for March 2025. You can drill down from year to month and even day level reports by clicking on the graphs.

01 · Temperature

Columbus Airport Temperature History March 2025
Temperature history in March 2025 at Columbus AirportFebApr181522291234567891011121314151617181920212223242526272829303125°F40°F55°F70°F85°F25°F40°F55°F70°F85°FFebApr181522291234567891011121314151617181920212223242526272829303125°F35°F45°F55°F65°F75°F85°F25°F35°F45°F55°F65°F75°F85°FFebApr181522291234567891011121314151617181920212223242526272829303125°F35°F45°F55°F65°F75°F85°F25°F35°F45°F55°F65°F75°F85°FFebApr181522291234567891011121314151617181920212223242526272829303125°F30°F35°F40°F45°F50°F55°F60°F65°F70°F75°F80°F85°F90°F25°F30°F35°F40°F45°F50°F55°F60°F65°F70°F75°F80°F85°F90°F
Average high Average low 25th to 75th percentile 10th to 90th percentile Reported temperature Daily range 24-hour high 24-hour low
The daily range of reported temperatures (gray bars) and 24-hour highs (red ticks) and lows (blue ticks), placed over the daily average high (faint red line) and low (faint blue line) temperature, with 25th to 75th and 10th to 90th percentile bands.

Hourly Temperature in March 2025 at Columbus Airport

Hourly Temperature in March 2025 at Columbus AirportFebApr181522291234567891011121314151617181920212223242526272829303112 AM6 AM12 PM6 PM12 AM12 AM6 AM12 PM6 PM12 AMcoldcoolFebApr181522291234567891011121314151617181920212223242526272829303112 AM6 AM12 PM6 PM12 AM12 AM6 AM12 PM6 PM12 AMwarmcoolcoldFebApr181522291234567891011121314151617181920212223242526272829303112 AM3 AM6 AM9 AM12 PM3 PM6 PM9 PM12 AM12 AM3 AM6 AM9 AM12 PM3 PM6 PM9 PM12 AMcoldcoolwarmcomfortableFebApr181522291234567891011121314151617181920212223242526272829303112 AM3 AM6 AM9 AM12 PM3 PM6 PM9 PM12 AM12 AM3 AM6 AM9 AM12 PM3 PM6 PM9 PM12 AMcoldcoolwarmcomfortablevery cold
frigid 15°F freezing 32°F very cold 45°F cold 55°F cool 65°F comfortable 75°F warm 85°F hot 95°F sweltering
The hourly reported temperature, color coded into bands. The shaded overlays indicate night and civil twilight.
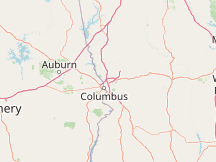
Map
Marker
© OpenStreetMap contributors

Compare Columbus Airport to:

Map
02 · Clouds

Cloud Cover in March 2025 at Columbus Airport

Cloud Cover in March 2025 at Columbus AirportFebApr181522291234567891011121314151617181920212223242526272829303112 AM6 AM12 PM6 PM12 AM12 AM6 AM12 PM6 PM12 AMFebApr181522291234567891011121314151617181920212223242526272829303112 AM6 AM12 PM6 PM12 AM12 AM6 AM12 PM6 PM12 AMFebApr181522291234567891011121314151617181920212223242526272829303112 AM3 AM6 AM9 AM12 PM3 PM6 PM9 PM12 AM12 AM3 AM6 AM9 AM12 PM3 PM6 PM9 PM12 AMFebApr181522291234567891011121314151617181920212223242526272829303112 AM3 AM6 AM9 AM12 PM3 PM6 PM9 PM12 AM12 AM3 AM6 AM9 AM12 PM3 PM6 PM9 PM12 AM
0% clear 20% mostly clear 40% partly cloudy 60% mostly cloudy 80% overcast 100%
no significant cloudno cloud detectedceiling and visibility ok
The hourly reported cloud coverage, categorized by the percentage of the sky covered by clouds.
03 · Precipitation

Daily Precipitation in March 2025 at Columbus Airport

Daily Precipitation in March 2025 at Columbus AirportFebApr18152229123456789101112131415161718192021222324252627282930310 in2 in4 in0 in2 in4 inFebApr18152229123456789101112131415161718192021222324252627282930310 in1 in2 in3 in4 in5 in0 in1 in2 in3 in4 in5 inFebApr18152229123456789101112131415161718192021222324252627282930310 in1 in2 in3 in4 in5 in0 in1 in2 in3 in4 in5 inFebApr18152229123456789101112131415161718192021222324252627282930310 in1 in2 in3 in4 in5 in0 in1 in2 in3 in4 in5 in
The daily measured quantity of liquid or liquid-equivalent precipitation.
04 · Observed Weather

Observed Weather in March 2025 at Columbus Airport

Observed Weather in March 2025 at Columbus AirportFebApr181522291234567891011121314151617181920212223242526272829303112 AM6 AM12 PM6 PM12 AM12 AM6 AM12 PM6 PM12 AMFebApr181522291234567891011121314151617181920212223242526272829303112 AM6 AM12 PM6 PM12 AM12 AM6 AM12 PM6 PM12 AMFebApr181522291234567891011121314151617181920212223242526272829303112 AM3 AM6 AM9 AM12 PM3 PM6 PM9 PM12 AM12 AM3 AM6 AM9 AM12 PM3 PM6 PM9 PM12 AMFebApr181522291234567891011121314151617181920212223242526272829303112 AM3 AM6 AM9 AM12 PM3 PM6 PM9 PM12 AM12 AM3 AM6 AM9 AM12 PM3 PM6 PM9 PM12 AM
foghazedrizzlelight rainmoderate rainheavy rainfreezing rainsleetsnow grainslight snowmoderate snowheavy snowhailthunderstorm
The hourly observed weather, color coded by category (in order of severity). If multiple reports are present, the most severe code is shown.
DayObservationsPrecipitationCodes
Wed, Mar 5 Thunderstorm in the Vicinity, Thunderstorm with Heavy Rain, Thunderstorm with Light Rain, Thunderstorm with Rain, Heavy Rain, Rain, Light Rain, Mist1.11 inVCTS, +TSRA, -TSRA, TSRA, +RA, RA, -RA, BR
Sat, Mar 8 HazeHZ
Sun, Mar 9 Thunderstorm in the Vicinity, Rain, Light Rain0.09 inVCTS, RA, -RA
Mon, Mar 10 Rain, Light Rain, Mist0.46 inRA, -RA, BR
Thu, Mar 13 Thunderstorm in the Vicinity0.00 inVCTS
Fri, Mar 14 Light Rain, Mist0.00 in-RA, BR
Sat, Mar 15 Light Rain0.00 in-RA
Sun, Mar 16 Thunderstorm in the Vicinity, Thunderstorm with Heavy Rain, Thunderstorm with Light Rain, Thunderstorm with Rain, Heavy Rain, Light Rain, Fog, Mist1.51 inVCTS, +TSRA, -TSRA, TSRA, +RA, -RA, FG, BR
Tue, Mar 18 SmokeFU
Wed, Mar 19 Smoke0.00 inFU
Thu, Mar 20 Rain, Light Rain, Smoke, Squall0.02 inRA, -RA, FU, SQ
Fri, Mar 21 SmokeFU
Sat, Mar 22 SmokeFU
Sun, Mar 23 Haze, SmokeHZ, FU
Mon, Mar 24 Thunderstorm in the Vicinity, Thunderstorm with Heavy Rain, Thunderstorm with Light Rain, Thunderstorm with Rain, Rain, Light Rain, Mist, Smoke0.13 inVCTS, +TSRA, -TSRA, TSRA, RA, -RA, BR, FU
Tue, Mar 25 Fog, MistFG, BR
Wed, Mar 26 Light Rain0.00 in-RA
Thu, Mar 27 HazeHZ
Fri, Mar 28 HazeHZ
Sat, Mar 29 HazeHZ
Sun, Mar 30 Heavy Rain, Rain, Light Rain, Fog, Mist0.80 in+RA, RA, -RA, FG, BR
Mon, Mar 31 Thunderstorm in the Vicinity, Thunderstorm with Heavy Rain, Thunderstorm with Light Rain, Thunderstorm with Rain, Rain, Light Rain, Fog, Mist0.54 inVCTS, +TSRA, -TSRA, TSRA, RA, -RA, FG, BR
05 · Sun

Hours of Daylight and Twilight in March 2025 at Columbus Airport

Hours of daylight Daylight Civil twilight Nautical twilight Astronomical twilight Night
The number of hours during which the Sun is visible (black line). From bottom (most yellow) to top (most gray), the color bands indicate: full daylight, twilight (civil, nautical, and astronomical), and full night.

Sunrise & Sunset with Twilight and Daylight Saving Time in March 2025 at Columbus Airport

Daylight Civil twilight Nautical twilight Astronomical twilight Night
The solar day over the course of March 2025. From bottom to top, the black lines are the previous solar midnight, sunrise, solar noon, sunset, and the next solar midnight. The day, twilights (civil, nautical, and astronomical), and night are indicated by the color bands from yellow to gray. The transitions to and from daylight saving time are indicated by the 'DST' labels.

Solar Elevation and Azimuth in March 2025 at Columbus Airport

Solar Elevation and Azimuth in March 2025 at Columbus AirportMarFebApr1234567891011121314151617181920212223242526272829303112 AM4 AM8 AM12 PM4 PM8 PM12 AM12 AM4 AM8 AM12 PM4 PM8 PM12 AM00101010102020202040404040505060600000101020202020303050505050MarFebApr1234567891011121314151617181920212223242526272829303112 AM4 AM8 AM12 PM4 PM8 PM12 AM12 AM4 AM8 AM12 PM4 PM8 PM12 AM00101010102020202030304040404050506060000010102020202030303030404050505050MarFebApr1234567891011121314151617181920212223242526272829303112 AM2 AM4 AM6 AM8 AM10 AM12 PM2 PM4 PM6 PM8 PM10 PM12 AM12 AM2 AM4 AM6 AM8 AM10 AM12 PM2 PM4 PM6 PM8 PM10 PM12 AM00101010102020202030304040404050506060000010102020202030303030404050505050MarFebApr1234567891011121314151617181920212223242526272829303112 AM2 AM4 AM6 AM8 AM10 AM12 PM2 PM4 PM6 PM8 PM10 PM12 AM12 AM2 AM4 AM6 AM8 AM10 AM12 PM2 PM4 PM6 PM8 PM10 PM12 AM00101010102020202030304040404050506060000010102020202030303030404050505050
Sunrise and sunset Solar elevation Night and civil twilight
northeastsouthwest
Solar elevation and azimuth over the course of March 2025. The black lines are lines of constant solar elevation (the angle of the sun above the horizon, in degrees). The background color fills indicate the azimuth (the compass bearing) of the sun. The lightly tinted areas at the boundaries of the cardinal compass points indicate the implied intermediate directions (northeast, southeast, southwest, and northwest).
06 · Moon

Moon Rise, Set & Phases in March 2025 at Columbus Airport

Moon Rise, Set & Phases in March 2025 at Columbus AirportFebApr181522291234567891011121314151617181920212223242526272829303112 AM8 AM4 PM12 AM12 AM8 AM4 PM12 AMFeb 277:45 PMFeb 277:45 PMMar 142:55 AMMar 142:55 AMMar 296:58 AMMar 296:58 AM7:26 PM7:26 PM8:00 AM8:00 AMFebApr181522291234567891011121314151617181920212223242526272829303112 AM4 AM8 AM12 PM4 PM8 PM12 AM12 AM4 AM8 AM12 PM4 PM8 PM12 AMFeb 277:45 PMFeb 277:45 PMMar 142:55 AMMar 142:55 AMMar 296:58 AMMar 296:58 AM7:02 AM7:02 AM6:25 PM6:25 PM7:26 PM7:26 PM7:32 AM7:32 AM8:32 PM8:32 PMFebApr181522291234567891011121314151617181920212223242526272829303112 AM4 AM8 AM12 PM4 PM8 PM12 AM12 AM4 AM8 AM12 PM4 PM8 PM12 AMFeb 277:45 PMFeb 277:45 PMMar 142:55 AMMar 142:55 AMMar 296:58 AMMar 296:58 AM7:02 AM7:02 AM6:25 PM6:25 PM7:26 PM7:26 PM8:00 AM8:00 AM7:32 AM7:32 AM8:32 PM8:32 PMFebApr181522291234567891011121314151617181920212223242526272829303112 AM4 AM8 AM12 PM4 PM8 PM12 AM12 AM4 AM8 AM12 PM4 PM8 PM12 AMFeb 277:45 PMFeb 277:45 PMMar 142:55 AMMar 142:55 AMMar 296:58 AMMar 296:58 AM7:02 AM7:02 AM6:25 PM6:25 PM7:26 PM7:26 PM8:00 AM8:00 AM7:32 AM7:32 AM8:32 PM8:32 PM
Moon above the horizon Full moon New moon Night and civil twilight
The time in which the moon is above the horizon (light blue area), with new moons (dark gray lines) and full moons (blue lines) indicated. The shaded overlays indicate night and civil twilight.
Mar 2025IlluminationMoonriseMoonsetMoonriseMeridian PassingDistance
1
4%8:05 AME8:45 PMW-2:23 PMS224,917 mi
2
11%8:36 AME9:55 PMWNW-3:13 PMS225,335 mi
3
20%9:10 AMENE11:07 PMWNW-4:05 PMS226,651 mi
4
30%9:47 AMENE--4:59 PMS228,661 mi
5
42%-12:19 AMWNW10:30 AMENE5:57 PMS231,129 mi
6
50%-1:30 AMWNW11:20 AMENE6:57 PMS233,824 mi
7
65%-2:36 AMNW12:18 PMNE7:57 PMS236,559 mi
8
75%-3:34 AMNW1:20 PMENE8:54 PMS239,201 mi
9
77%-5:24 AMWNW3:24 PMENE1:45 AMWNW239,696 mi
10
91%-6:05 AMWNW4:28 PMENE11:37 PMS243,945 mi
11
93%-6:40 AMWNW5:30 PMENE--
12
96%-7:09 AMWNW6:29 PMENE12:23 AMS246,001 mi
13
99%-7:36 AMW7:26 PME1:05 AMS247,831 mi
14
100%-8:00 AMW8:21 PME1:45 AMS249,413 mi
15
99%-8:25 AMW9:16 PME2:24 AMS250,699 mi
16
96%-8:49 AMWSW10:12 PMESE3:03 AMS251,620 mi
17
92%-9:15 AMWSW11:08 PMESE3:44 AMS252,086 mi
18
86%-9:44 AMWSW-4:26 AMS251,999 mi
19
78%12:06 AMESE10:18 AMWSW-5:12 AMS251,265 mi
20
70%1:05 AMESE10:57 AMWSW-6:01 AMS249,814 mi
21
60%2:04 AMSE11:43 AMSW-6:53 AMS247,619 mi
22
50%3:00 AMSE12:37 PMSW-7:49 AMS244,714 mi
23
40%3:52 AMSE1:38 PMWSW-8:45 AMS241,212 mi
24
29%4:39 AMESE2:43 PMWSW-9:41 AMS237,309 mi
25
19%5:20 AMESE3:51 PMWSW-10:36 AMS233,281 mi
26
11%5:57 AMESE5:01 PMWSW-11:28 AMS229,465 mi
27
5%6:30 AMESE6:10 PMW-12:19 PMS226,218 mi
28
1%7:01 AME7:20 PMW-1:09 PMS223,871 mi
29
0%7:32 AME8:32 PMW-1:59 PMS222,666 mi
30
3%8:05 AMENE9:45 PMWNW-2:51 PMS222,714 mi
31
8%8:42 AMENE11:00 PMWNW-3:47 PMS223,974 mi
07 · Humidity

Humidity Comfort Levels in March 2025 at Columbus Airport

Humidity Comfort Levels in March 2025 at Columbus AirportFebApr181522291234567891011121314151617181920212223242526272829303112 AM6 AM12 PM6 PM12 AM12 AM6 AM12 PM6 PM12 AMFebApr181522291234567891011121314151617181920212223242526272829303112 AM6 AM12 PM6 PM12 AM12 AM6 AM12 PM6 PM12 AMFebApr181522291234567891011121314151617181920212223242526272829303112 AM3 AM6 AM9 AM12 PM3 PM6 PM9 PM12 AM12 AM3 AM6 AM9 AM12 PM3 PM6 PM9 PM12 AMFebApr181522291234567891011121314151617181920212223242526272829303112 AM3 AM6 AM9 AM12 PM3 PM6 PM9 PM12 AM12 AM3 AM6 AM9 AM12 PM3 PM6 PM9 PM12 AM
dry 55°F comfortable 60°F humid 65°F muggy 70°F oppressive 75°F miserable
The hourly reported humidity comfort level, categorized by dew point. The shaded overlays indicate night and civil twilight.
08 · Wind

Wind Speed in March 2025 at Columbus Airport

Wind Speed in March 2025 at Columbus AirportFebApr18152229123456789101112131415161718192021222324252627282930310 mph20 mph40 mph0 mph20 mph40 mphFebApr18152229123456789101112131415161718192021222324252627282930310 mph10 mph20 mph30 mph40 mph50 mph0 mph10 mph20 mph30 mph40 mph50 mphFebApr18152229123456789101112131415161718192021222324252627282930310 mph10 mph20 mph30 mph40 mph50 mph0 mph10 mph20 mph30 mph40 mph50 mphFebApr18152229123456789101112131415161718192021222324252627282930310 mph10 mph20 mph30 mph40 mph50 mph0 mph10 mph20 mph30 mph40 mph50 mph
The daily range of reported wind speeds (gray bars), with maximum gust speeds (red ticks).

Hourly Wind Speed in March 2025 at Columbus Airport

Hourly Wind Speed in March 2025 at Columbus AirportFebApr181522291234567891011121314151617181920212223242526272829303112 AM6 AM12 PM6 PM12 AM12 AM6 AM12 PM6 PM12 AMFebApr181522291234567891011121314151617181920212223242526272829303112 AM6 AM12 PM6 PM12 AM12 AM6 AM12 PM6 PM12 AMFebApr181522291234567891011121314151617181920212223242526272829303112 AM3 AM6 AM9 AM12 PM3 PM6 PM9 PM12 AM12 AM3 AM6 AM9 AM12 PM3 PM6 PM9 PM12 AMFebApr181522291234567891011121314151617181920212223242526272829303112 AM3 AM6 AM9 AM12 PM3 PM6 PM9 PM12 AM12 AM3 AM6 AM9 AM12 PM3 PM6 PM9 PM12 AM
0 mph calm 1 mph light air 4 mph light breeze 8 mph gentle breeze 13 mph moderate breeze 18 mph fresh breeze 25 mph strong breeze 31 mph near gale 39 mph gale 47 mph strong gale 55 mph storm 64 mph violent storm 73 mph hurricane force
The hourly reported wind speed, color coded into bands according to the Beaufort scale. The shaded overlays indicate night and civil twilight.
09 · Growing Degree Days
Growing degree days are a measure of yearly heat accumulation used to predict plant and animal development, and defined as the integral of warmth above a base temperature, discarding any excess above a maximum temperature. In this report, we use a base of 50°F and a cap of 86°F.

Growing Degree Days in March 2025 at Columbus Airport

Growing Degree Days in March 2025 at Columbus AirportMarFebApr12345678910111213141516171819202122232425262728293031200°F400°F600°F200°F400°F600°FMarFebApr12345678910111213141516171819202122232425262728293031200°F300°F400°F500°F600°F700°F200°F300°F400°F500°F600°F700°FMarFebApr12345678910111213141516171819202122232425262728293031200°F300°F400°F500°F600°F700°F200°F300°F400°F500°F600°F700°FMarFebApr12345678910111213141516171819202122232425262728293031200°F300°F400°F500°F600°F700°F200°F300°F400°F500°F600°F700°F
Average growing degree days 25th to 75th percentile 10th to 90th percentile
The growing degree days accumulated from reported temperatures over the course of March 2025 (solid black line), placed over the average accumulation (faint line), with 25th to 75th and 10th to 90th percentile bands. Gaps indicate days without enough temperature reports to calculate a complete daily value; totals following gaps may therefore be understated.
10 · Wind Direction

Hourly Wind Direction in 2025 at Columbus Airport

Hourly Wind Direction in 2025 at Columbus AirportFebApr181522291234567891011121314151617181920212223242526272829303112 AM6 AM12 PM6 PM12 AM12 AM6 AM12 PM6 PM12 AMFebApr181522291234567891011121314151617181920212223242526272829303112 AM6 AM12 PM6 PM12 AM12 AM6 AM12 PM6 PM12 AMFebApr181522291234567891011121314151617181920212223242526272829303112 AM3 AM6 AM9 AM12 PM3 PM6 PM9 PM12 AM12 AM3 AM6 AM9 AM12 PM3 PM6 PM9 PM12 AMFebApr181522291234567891011121314151617181920212223242526272829303112 AM3 AM6 AM9 AM12 PM3 PM6 PM9 PM12 AM12 AM3 AM6 AM9 AM12 PM3 PM6 PM9 PM12 AM
calmnortheastsouthwest
The hourly reported wind direction, color coded by compass point. The shaded overlays indicate night and civil twilight.
11 · Pressure

Atmospheric Pressure in March 2025 at Columbus Airport

Atmospheric Pressure in March 2025 at Columbus AirportFebApr181522291234567891011121314151617181920212223242526272829303129.6 inHg30.0 inHg30.4 inHg29.6 inHg30.0 inHg30.4 inHgFebApr181522291234567891011121314151617181920212223242526272829303129.6 inHg29.8 inHg30.0 inHg30.2 inHg30.4 inHg30.6 inHg29.6 inHg29.8 inHg30.0 inHg30.2 inHg30.4 inHg30.6 inHgFebApr181522291234567891011121314151617181920212223242526272829303129.6 inHg29.8 inHg30.0 inHg30.2 inHg30.4 inHg30.6 inHg29.6 inHg29.8 inHg30.0 inHg30.2 inHg30.4 inHg30.6 inHgFebApr181522291234567891011121314151617181920212223242526272829303129.6 inHg29.8 inHg30.0 inHg30.2 inHg30.4 inHg30.6 inHg29.6 inHg29.8 inHg30.0 inHg30.2 inHg30.4 inHg30.6 inHg
The daily range of atmospheric pressure (gray bars), as measured by the altimeter setting reported in e.g. a METAR report.
12 · Inventory

Reports by Month

METARISDboth
The number of reports per month over the entire history of this station.

Number of Reports by Day in March 2025 at Columbus Airport

regularspecialcorrection
The number of reports per day.

Reports by Hour in March 2025 at Columbus Airport

Reports by Hour in March 2025 at Columbus AirportFebApr181522291234567891011121314151617181920212223242526272829303112 AM6 AM12 PM6 PM12 AM12 AM6 AM12 PM6 PM12 AMFebApr181522291234567891011121314151617181920212223242526272829303112 AM6 AM12 PM6 PM12 AM12 AM6 AM12 PM6 PM12 AMFebApr181522291234567891011121314151617181920212223242526272829303112 AM3 AM6 AM9 AM12 PM3 PM6 PM9 PM12 AM12 AM3 AM6 AM9 AM12 PM3 PM6 PM9 PM12 AMFebApr181522291234567891011121314151617181920212223242526272829303112 AM3 AM6 AM9 AM12 PM3 PM6 PM9 PM12 AM12 AM3 AM6 AM9 AM12 PM3 PM6 PM9 PM12 AM
regularspecialcorrection
Indication of what types of reports were recorded during each hour.
13 · Data Sources

This report graphically illustrates the historical weather reports recorded by the weather station at Columbus Airport in March 2025.

METAR Reports

Airport weather stations throughout the world routinely issue METAR weather reports . Such reports are used by pilots, air traffic controllers, meteorologists, climatologists, and other researchers. They are published via radio transmission and on the internet. We have been collecting and archiving published METAR reports since 2011, and have found third-party sources for archived reports from years prior to that.

ISD Reports

The Integrated Surface Database (ISD), maintained and published by NOAA's National Center for Environmental Information , consists of hourly and synoptic weather reports from a variety of sources. We use ISD data to complement and backfill for our METAR archive.

Other Data

The sources for the averages shown in the daily temperature chart are discussed in greater detail on this station's Averages Report.

All data relating to the Sun's position (e.g., sunrise and sunset) are computed using astronomical formulas from the book, Astronomical Algorithms 2nd Edition , by Jean Meeus.

Names, locations, and time zones of places and some airports come from the GeoNames Geographical Database .

Time zones for airports and weather stations are provided by AskGeo.com .

Maps are © OpenStreetMap contributors.

Disclaimer

The information on this site is provided as is, without any assurances as to its accuracy or suitability for any purpose. Weather data is prone to errors, outages, and other defects. We assume no responsibility for any decisions made on the basis of the content presented on this site.

We draw particular cautious attention to our reliance on the MERRA-2 model-based reconstructions for a number of important data series. While having the tremendous advantages of temporal and spatial completeness, these reconstructions: (1) are based on computer models that may have model-based errors, (2) are coarsely sampled on a 50 km grid and are therefore unable to reconstruct the local variations of many microclimates, and (3) have particular difficulty with the weather in some coastal areas, especially small islands.

We further caution that our travel scores are only as good as the data that underpin them, that weather conditions at any given location and time are unpredictable and variable, and that the definition of the scores reflects a particular set of preferences that may not agree with those of any particular reader.

Please review our full terms contained on our Terms of Service page.