Loading…
January 2020 Weather History at Rochester, Rochester International Airport
This report shows the past weather for Rochester, Rochester International Airport, providing a weather history for January 2020. It features all historical weather data series we have available, including the Rochester, Rochester International Airport temperature history for January 2020. You can drill down from year to month and even day level reports by clicking on the graphs.
Rochester, Rochester International Airport Temperature History January 2020
Hourly Temperature in January 2020 at Rochester, Rochester International Airport
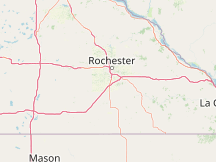

Compare Rochester, Rochester International Airport to:
Cloud Cover in January 2020 at Rochester, Rochester International Airport
Observed Weather in January 2020 at Rochester, Rochester International Airport
| Day | Observations | Precipitation | Codes |
|---|---|---|---|
| Fri, Jan 3 | Light Snow, Mist | 0.01 in | -SN, BR |
| Tue, Jan 7 | Light Snow, Mist | 0.02 in | -SN, BR |
| Sun, Jan 12 | Light Snow, Mist | 0.08 in | -SN, BR |
| Mon, Jan 13 | Snow, Light Snow, Freezing Fog, Mist | 0.15 in | SN, -SN, FZFG, BR |
| Tue, Jan 14 | Mist | 0.00 in | BR |
| Wed, Jan 15 | Snow, Light Snow, Haze, Freezing Fog, Mist | 0.03 in | SN, -SN, HZ, FZFG, BR |
| Fri, Jan 17 | Heavy Snow, Snow, Light Snow, Light Freezing Rain, Freezing Fog, Mist, Unknown Precipitation | 0.24 in | +SN, SN, -SN, -FZRA, FZFG, BR, UP |
| Sat, Jan 18 | Heavy Snow, Snow, Light Snow, Light Freezing Rain, Haze, Freezing Fog, Mist, Unknown Precipitation | 0.05 in | +SN, SN, -SN, -FZRA, HZ, FZFG, BR, UP |
| Sun, Jan 19 | Light Snow, Haze, Unknown Precipitation | 0.00 in | -SN, HZ, UP |
| Mon, Jan 20 | Light Snow, Mist | 0.01 in | -SN, BR |
| Tue, Jan 21 | Haze, Mist | HZ, BR | |
| Wed, Jan 22 | Light Snow, Light Freezing Rain, Mist, Unknown Precipitation | 0.24 in | -SN, -FZRA, BR, UP |
| Thu, Jan 23 | Light Snow, Freezing Fog, Mist | 0.02 in | -SN, FZFG, BR |
| Fri, Jan 24 | Light Snow, Mist | 0.08 in | -SN, BR |
| Sat, Jan 25 | Light Snow, Mist | 0.00 in | -SN, BR |
| Sun, Jan 26 | Mist | BR | |
| Mon, Jan 27 | Light Snow, Mist | 0.00 in | -SN, BR |
| Tue, Jan 28 | Light Freezing Rain, Haze, Mist, Unknown Precipitation | 0.00 in | -FZRA, HZ, BR, UP |
| Wed, Jan 29 | Snow, Light Snow, Haze, Freezing Fog, Mist | 0.02 in | SN, -SN, HZ, FZFG, BR |
| Thu, Jan 30 | Haze, Mist | HZ, BR | |
| Fri, Jan 31 | Light Snow, Haze, Freezing Fog, Mist | 0.02 in | -SN, HZ, FZFG, BR |
Hours of Daylight and Twilight in January 2020 at Rochester, Rochester International Airport
Sunrise & Sunset with Twilight in January 2020 at Rochester, Rochester International Airport
Solar Elevation and Azimuth in January 2020 at Rochester, Rochester International Airport
Moon Rise, Set & Phases in January 2020 at Rochester, Rochester International Airport
| Jan 2020 | Illumination | Moonrise | Moonset | Moonrise | Meridian Passing | Distance | |||||
|---|---|---|---|---|---|---|---|---|---|---|---|
| 1 |
|
39% | 11:42 AM | E | 11:17 PM | W | - | 5:28 PM | S | 251,389 mi | |
| 2 |
|
50% | 12:04 PM | E | - | - | 6:09 PM | S | 251,029 mi | ||
| 3 |
|
58% | - | 12:17 AM | W | 12:26 PM | E | 6:50 PM | S | 249,809 mi | |
| 4 |
|
68% | - | 1:17 AM | W | 12:49 PM | E | 7:32 PM | S | 247,788 mi | |
| 5 |
|
77% | - | 2:19 AM | WNW | 1:14 PM | ENE | 8:15 PM | S | 245,097 mi | |
| 6 |
|
85% | - | 3:23 AM | WNW | 1:43 PM | ENE | 9:02 PM | S | 241,933 mi | |
| 7 |
|
92% | - | 4:29 AM | WNW | 2:17 PM | ENE | 9:53 PM | S | 238,547 mi | |
| 8 |
|
97% | - | 5:35 AM | WNW | 2:59 PM | ENE | 10:48 PM | S | 235,222 mi | |
| 9 |
|
100% | - | 6:40 AM | WNW | 3:50 PM | ENE | 11:45 PM | S | 232,248 mi | |
| 10 |
|
100% | - | 7:40 AM | WNW | 4:51 PM | ENE | - | - | ||
| 11 |
|
100% | - | 8:33 AM | WNW | 6:00 PM | ENE | 12:44 AM | S | 229,871 mi | |
| 12 |
|
97% | - | 9:19 AM | WNW | 7:15 PM | ENE | 1:43 AM | S | 228,261 mi | |
| 13 |
|
91% | - | 9:57 AM | WNW | 8:31 PM | ENE | 2:40 AM | S | 227,483 mi | |
| 14 |
|
83% | - | 10:29 AM | WNW | 9:47 PM | E | 3:34 AM | S | 227,501 mi | |
| 15 |
|
74% | - | 10:59 AM | W | 11:01 PM | E | 4:25 AM | S | 228,198 mi | |
| 16 |
|
62% | - | 11:26 AM | W | - | 5:16 AM | S | 229,418 mi | ||
| 17 |
|
50% | 12:14 AM | E | 11:53 AM | W | - | 6:05 AM | S | 231,004 mi | |
| 18 |
|
39% | 1:27 AM | ESE | 12:22 PM | WSW | - | 6:55 AM | S | 232,821 mi | |
| 19 |
|
28% | 2:38 AM | ESE | 12:54 PM | WSW | - | 7:47 AM | S | 234,774 mi | |
| 20 |
|
19% | 3:48 AM | ESE | 1:31 PM | WSW | - | 8:40 AM | S | 236,809 mi | |
| 21 |
|
11% | 4:56 AM | ESE | 2:13 PM | WSW | - | 9:34 AM | S | 238,902 mi | |
| 22 |
|
5% | 5:58 AM | ESE | 3:02 PM | WSW | - | 10:30 AM | S | 241,038 mi | |
| 23 |
|
1% | 6:53 AM | ESE | 3:58 PM | WSW | - | 11:25 AM | S | 243,195 mi | |
| 24 |
|
0% | 7:39 AM | ESE | 4:58 PM | WSW | - | 12:19 PM | S | 245,324 mi | |
| 25 |
|
1% | 8:19 AM | ESE | 6:00 PM | WSW | - | 1:09 PM | S | 247,346 mi | |
| 26 |
|
4% | 8:52 AM | ESE | 7:03 PM | WSW | - | 1:57 PM | S | 249,150 mi | |
| 27 |
|
8% | 9:20 AM | ESE | 8:04 PM | WSW | - | 2:42 PM | S | 250,603 mi | |
| 28 |
|
14% | 9:45 AM | ESE | 9:05 PM | W | - | 3:24 PM | S | 251,563 mi | |
| 29 |
|
22% | 10:07 AM | E | 10:05 PM | W | - | 4:05 PM | S | 251,897 mi | |
| 30 |
|
30% | 10:29 AM | E | 11:05 PM | W | - | 4:45 PM | S | 251,496 mi | |
| 31 |
|
40% | 10:51 AM | E | - | - | 5:26 PM | S | 250,293 mi | ||
Wind Speed in January 2020 at Rochester, Rochester International Airport
Hourly Wind Speed in January 2020 at Rochester, Rochester International Airport
Growing Degree Days in January 2020 at Rochester, Rochester International Airport
Reports by Month
Number of Reports by Day in January 2020 at Rochester, Rochester International Airport
Reports by Hour in January 2020 at Rochester, Rochester International Airport
Data Sources
This report graphically illustrates the historical weather reports recorded by the weather station at Rochester, Rochester International Airport in January 2020.
METAR Reports
Airport weather stations throughout the world routinely issue METAR weather reports . Such reports are used by pilots, air traffic controllers, meteorologists, climatologists, and other researchers. They are published via radio transmission and on the internet. We have been collecting and archiving published METAR reports since 2011, and have found third-party sources for archived reports from years prior to that.
ISD Reports
The Integrated Surface Database (ISD), maintained and published by NOAA's National Center for Environmental Information , consists of hourly and synoptic weather reports from a variety of sources. We use ISD data to complement and backfill for our METAR archive.
Other Data
The sources for the averages shown in the daily temperature chart are discussed in greater detail on this station's Averages Report.
All data relating to the Sun's position (e.g., sunrise and sunset) are computed using astronomical formulas from the book, Astronomical Algorithms 2nd Edition , by Jean Meeus.
Names, locations, and time zones of places and some airports come from the GeoNames Geographical Database .
Time zones for airports and weather stations are provided by AskGeo.com .
Maps are © OpenStreetMap contributors.
Disclaimer
The information on this site is provided as is, without any assurances as to its accuracy or suitability for any purpose. Weather data is prone to errors, outages, and other defects. We assume no responsibility for any decisions made on the basis of the content presented on this site.
We draw particular cautious attention to our reliance on the MERRA-2 model-based reconstructions for a number of important data series. While having the tremendous advantages of temporal and spatial completeness, these reconstructions: (1) are based on computer models that may have model-based errors, (2) are coarsely sampled on a 50 km grid and are therefore unable to reconstruct the local variations of many microclimates, and (3) have particular difficulty with the weather in some coastal areas, especially small islands.
We further caution that our travel scores are only as good as the data that underpin them, that weather conditions at any given location and time are unpredictable and variable, and that the definition of the scores reflects a particular set of preferences that may not agree with those of any particular reader.
Please review our full terms contained on our Terms of Service page.

You're permitted to use this graph as long as you provide prominent attribution with a link back close to the use of the graph. For example: © WeatherSpark.com
For print usage, please acquire a license.